Air quality in Colombo has deteriorated sharply over the last few months, with rising AQI readings (based on PM2.5 levels) indicating a steady decline since November 2024.
October 2024: Consistently Clean Air
In early October 2024, the weekly average AQI stayed within the “Good” range (0–50). Even the highest hourly values only reached “Moderate” levels (50–100), resulting in clean air and minimal health risks for everyone.
November 2024: Moderate Spikes
From November onwards, AQI levels began to climb. The weekly average moved into the “Moderate” category, and on some days, the highest readings reached “Unhealthy for Sensitive Groups” (100–150). These temporary but significant spikes posed health concerns, especially for individuals with existing respiratory issues.
December 2024: Approaching Unhealthy
By December, AQI readings continued to worsen. Toward the end of the month, the weekly average neared the upper range of “Unhealthy for Sensitive Groups,” while the highest hourly AQI soared to “Unhealthy” (over 150). During these times, air pollution presented a genuine health threat to the broader population.
January 2025: Reached “Very Unhealthy” Levels
By January, Colombo’s air quality reached very unhealthy levels. In the last week of the month, the weekly average reached “Unhealthy for Sensitive Groups,” and the highest hourly AQI spiked to a “Very Unhealthy” level—peaking at 202. Over the entire month, air quality was “Good” just 3.5% of the time, and 25% of January saw AQI readings over 100— in the “Unhealthy” zone.
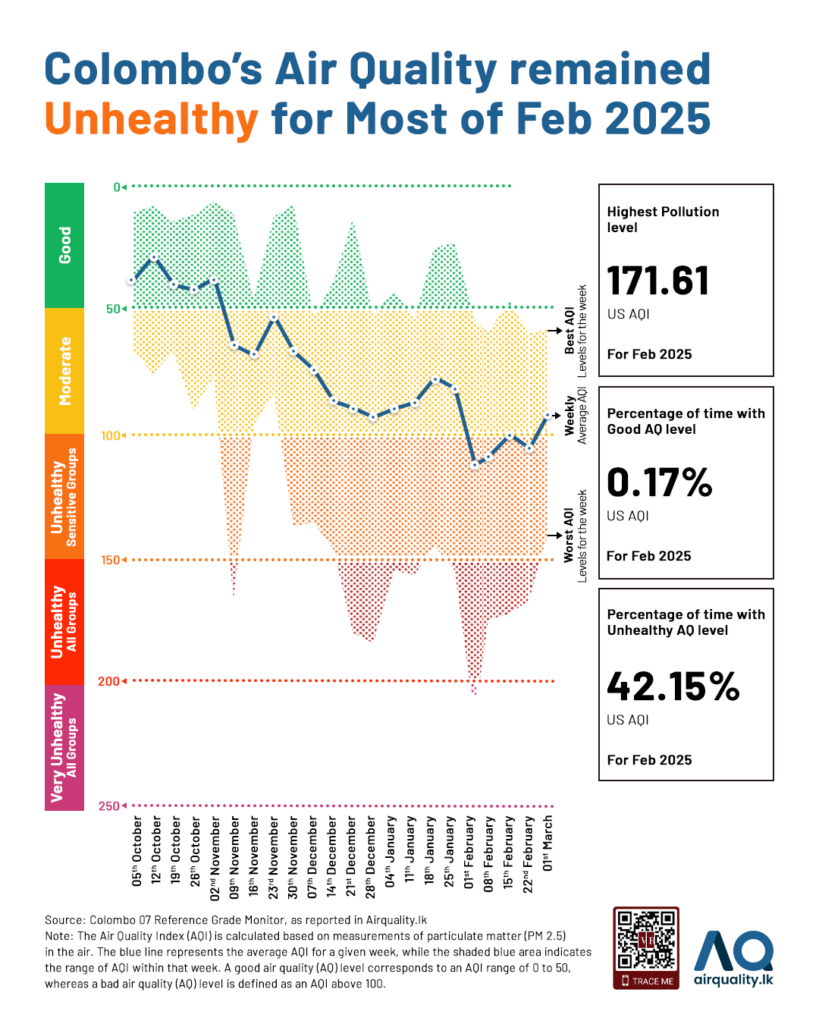
February 2025: Air Quality Remains Unhealthy
Despite a decrease in the maximum AQI compared to January, Colombo’s air quality remained unhealthy for most of February. The weekly average AQI fell within the “Unhealthy for Sensitive Groups” category in all weeks except the last. The highest recorded hourly AQI spiked to 171.6, reaching the “Unhealthy” level for all. Air quality was classified as “Good” only 0.17% of the time in February – the lowest in the last 5 months. In February, 42% of the time, the AQI readings exceeded 100, placing them in the “Unhealthy” zone.
Impacts of Bad Air Quality
Such high pollution levels indicate rising concentrations of harmful particles like PM2.5, which can affect health even after brief exposure. Poor air quality can trigger or worsen breathing and heart problems, especially among vulnerable groups such as children, older adults, and those with existing medical conditions.
Colombo’s increasing AQI highlights the importance of regularly monitoring air quality and taking preventive steps—both at individual and policy levels. This worsening trend is a clear warning sign that urgent, collective action is needed to improve air quality and protect public health.
Note: The AQI is calculated based on particulate matter (PM2.5) concentrations in the air. For details on how air quality is measured and categorised, refer to our previous blog. To convert PM2.5 levels into AQI values, recent standard breakpoints and calculations defined by the US Environmental Protection Agency (EPA) are used. This infographic displays the weekly average AQI as a line, offering a clearer picture of overall trends by smoothing out daily changes. The shaded area indicates the range of hourly AQI values (from minimum to maximum) recorded each week, illustrating the full spectrum of air quality conditions over that period.
Research by: Akshayvisnu Ramanathan and Anushan Kapilan
Visualisation by: Muaadh Himaz